> ## Documentation Index
> Fetch the complete documentation index at: https://upstash-worktree-docs-descriptions.mintlify.site/llms.txt
> Use this file to discover all available pages before exploring further.
# Prometheus - Upstash QStash Integration
> Scrape Upstash QStash metrics into Prometheus and visualize them in Grafana to monitor message delivery and performance.
To monitor your QStash metrics in Prometheus and visualize in Grafana, follow these steps:
**Integration Scope**
Upstash Prometheus Integration covers Prod Pack.
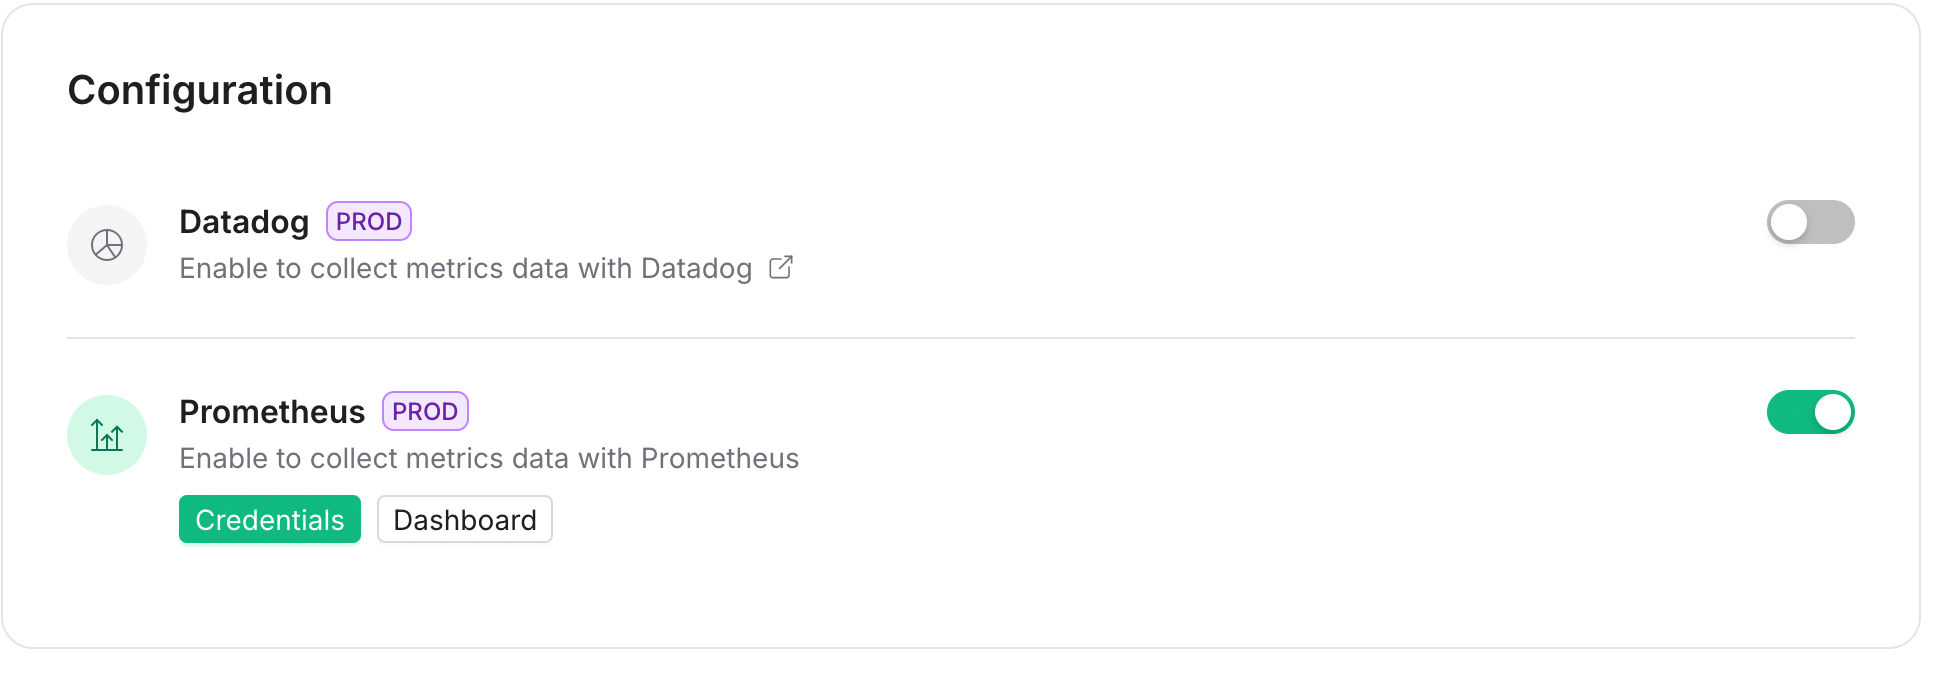
## **Step 1: Enable Prometheus in Upstash Console**
1. Open the Upstash Console and navigate to QStash.
2. Go to Settings → Monitoring.
3. Enable Prometheus to allow scraping QStash metrics.
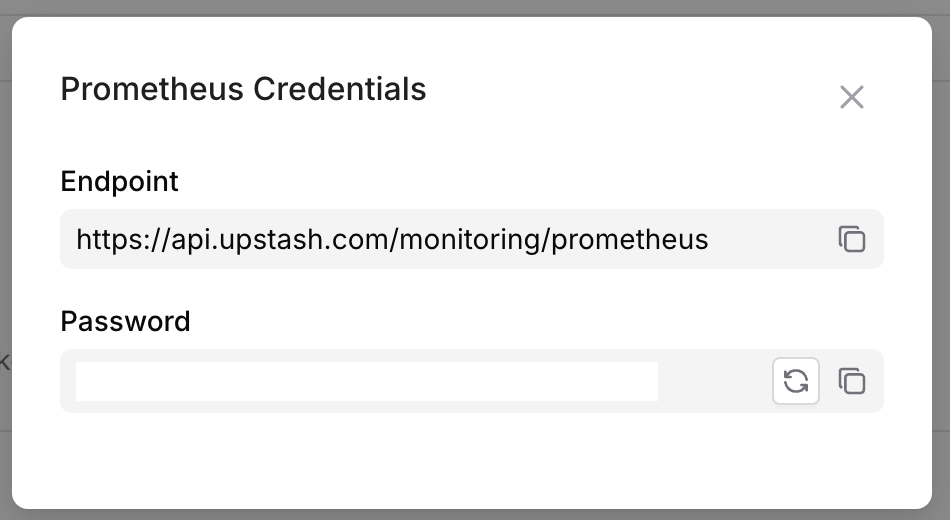
 ## **Step 2: Copy Monitoring Token**
1. After enabling, a monitoring token is generated and displayed.
2. Copy the token. It will be used to authenticate Prometheus requests.
**Header Format**
Send the token as `Authorization: Bearer `.
## **Step 2: Copy Monitoring Token**
1. After enabling, a monitoring token is generated and displayed.
2. Copy the token. It will be used to authenticate Prometheus requests.
**Header Format**
Send the token as `Authorization: Bearer `.
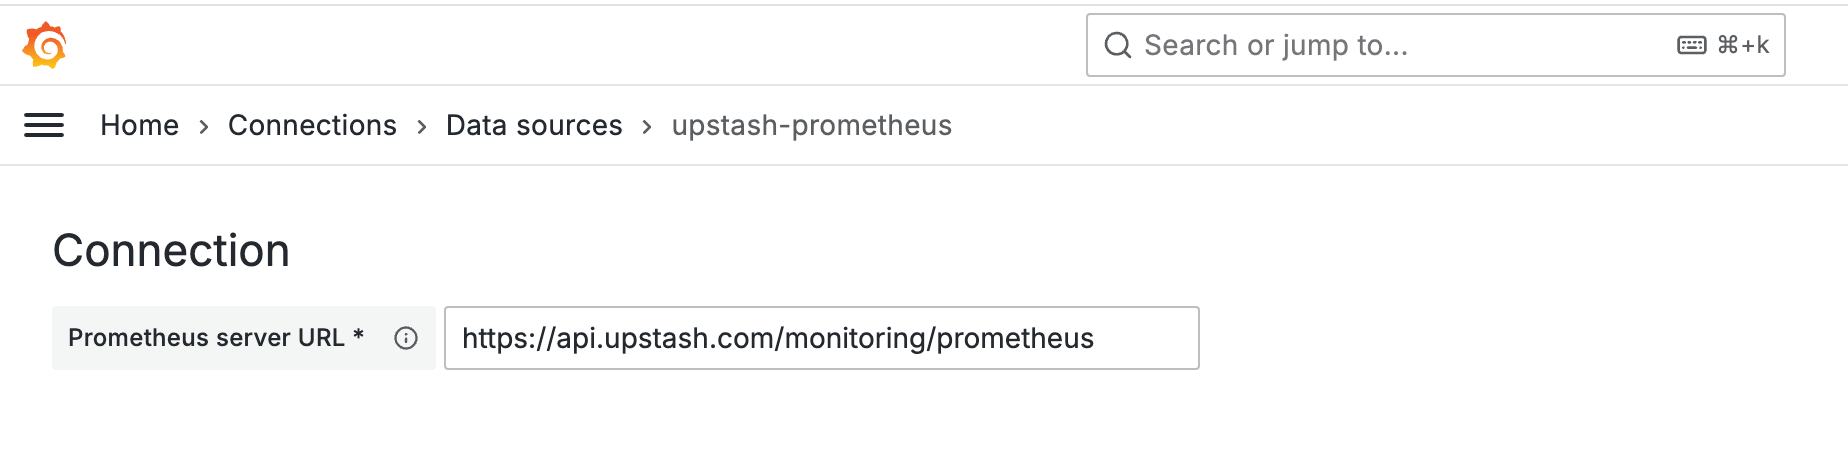
 ## **Step 3: Configure Prometheus (via Grafana Data Source)**
1. In Grafana, add a Prometheus data source.
2. Set the address to `https://api.upstash.com/monitoring/prometheus`.
3. In HTTP headers, add the monitoring token.
## **Step 3: Configure Prometheus (via Grafana Data Source)**
1. In Grafana, add a Prometheus data source.
2. Set the address to `https://api.upstash.com/monitoring/prometheus`.
3. In HTTP headers, add the monitoring token.
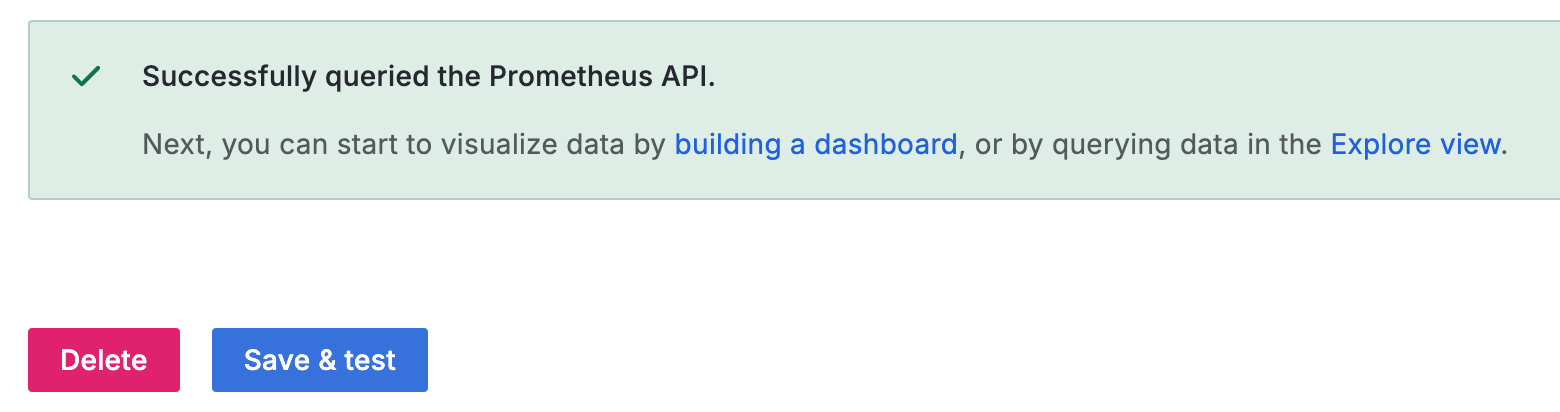
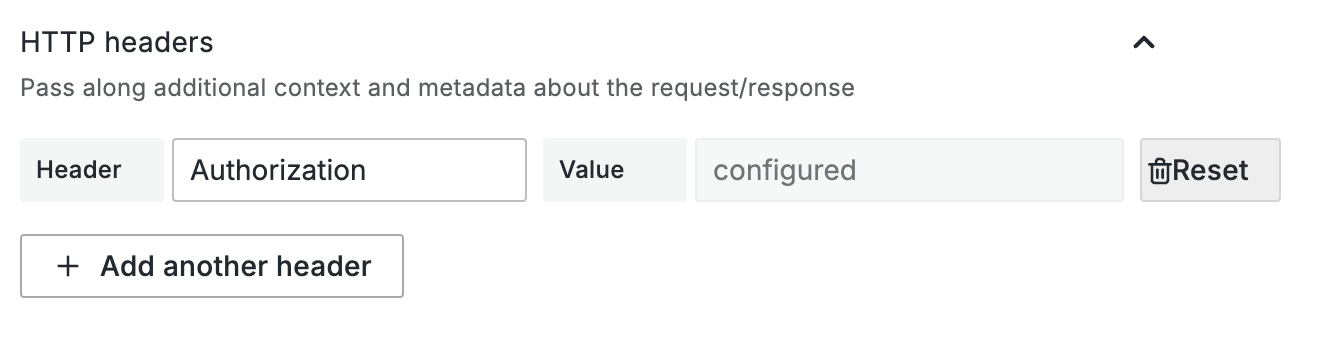 Click Test and Save.
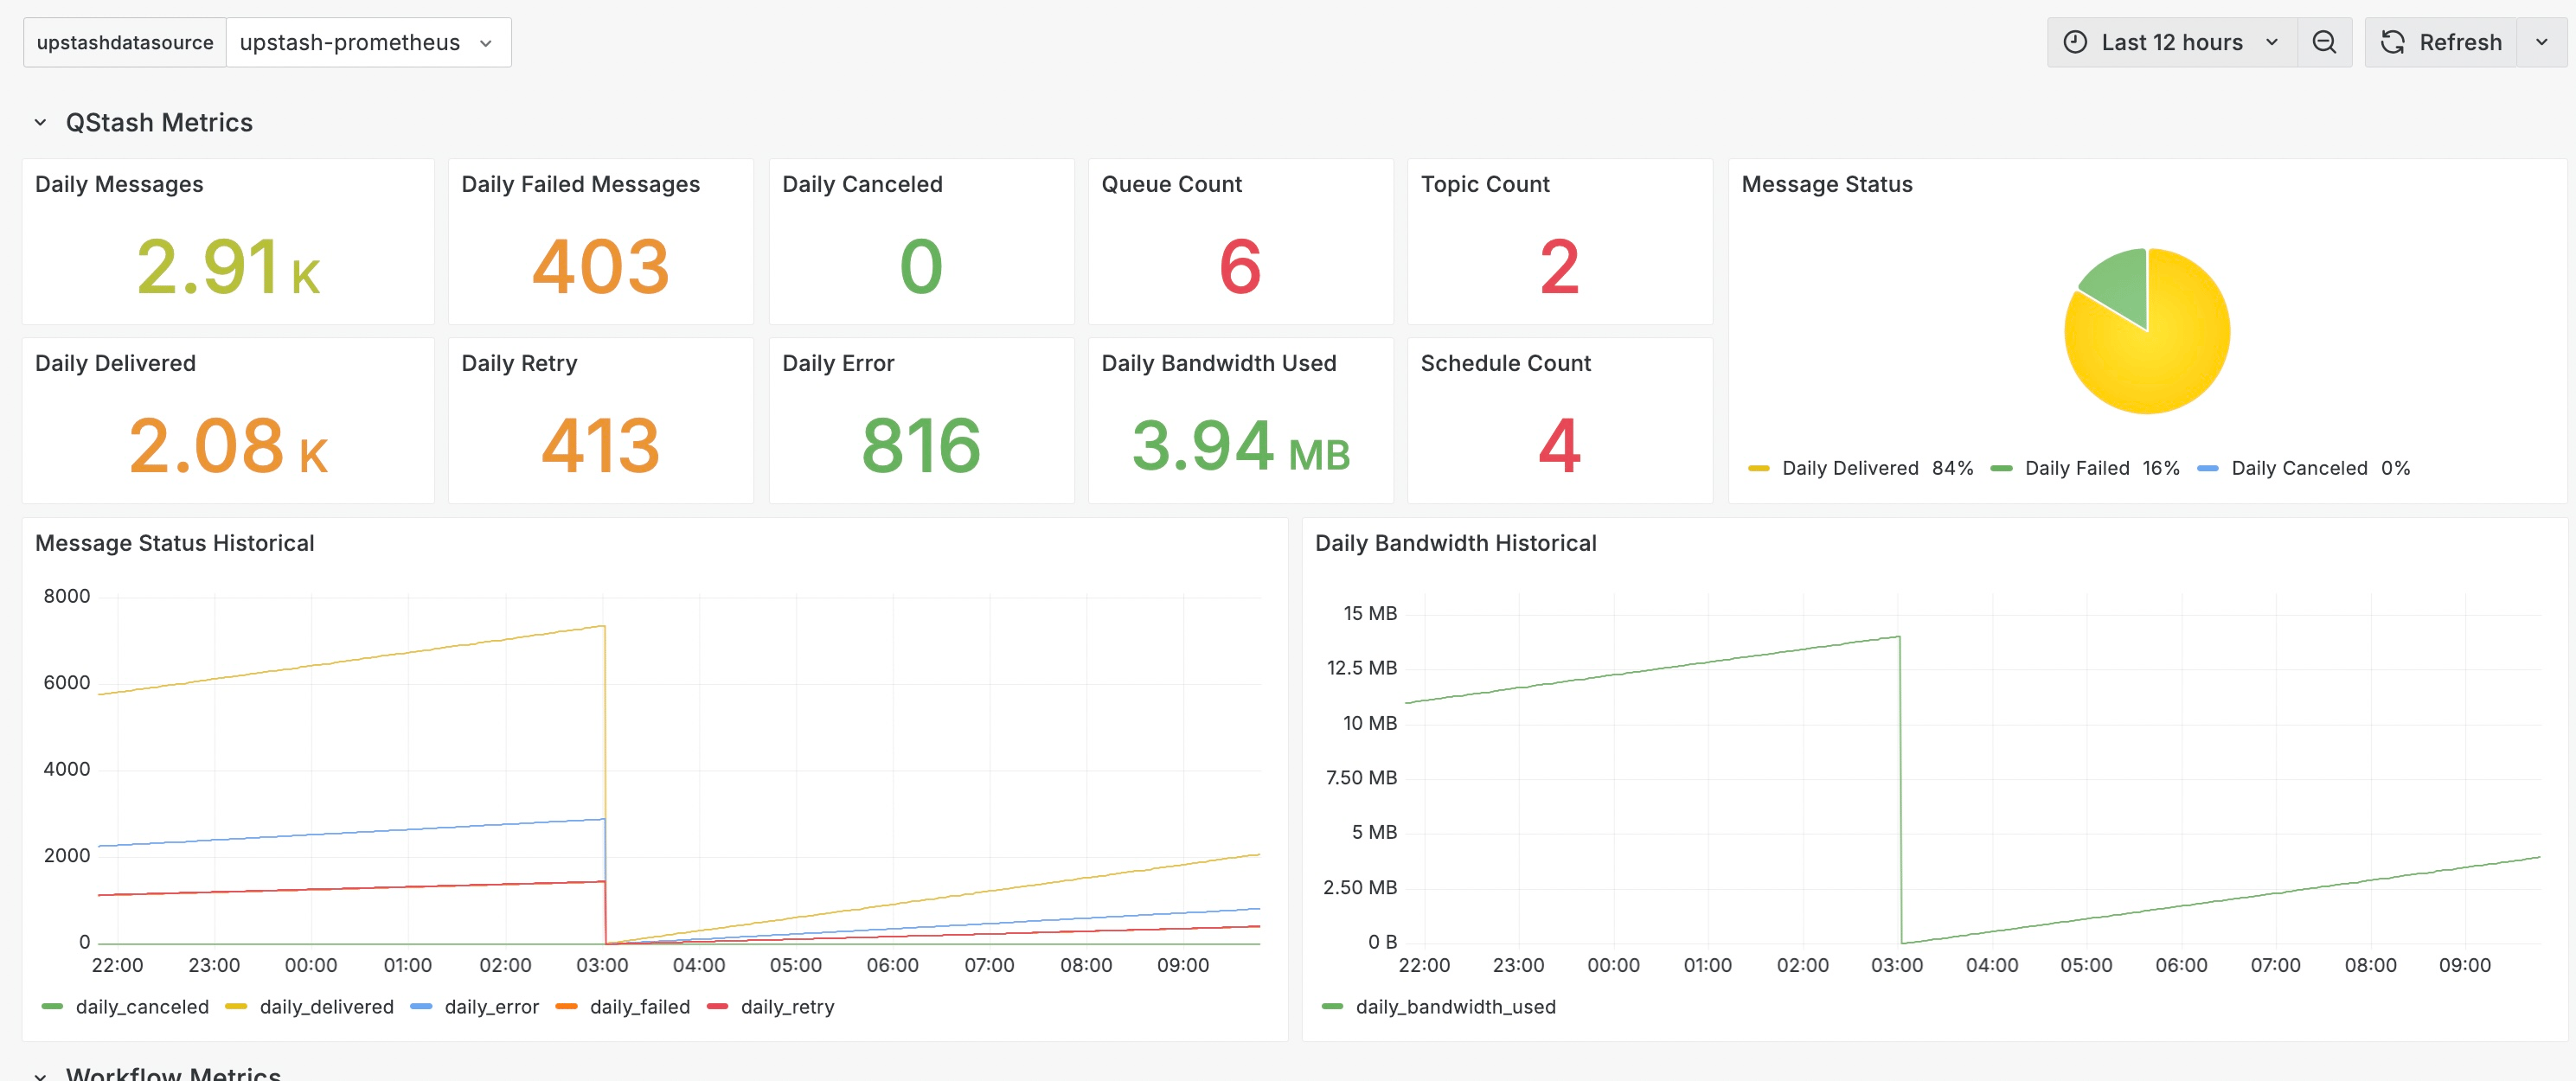
 ## **Step 4: Import Dashboard**
You can use the Upstash Grafana dashboard to visualize QStash metrics.
Open the import dialog and use: Upstash QStash Dashboard
## **Step 4: Import Dashboard**
You can use the Upstash Grafana dashboard to visualize QStash metrics.
Open the import dialog and use: Upstash QStash Dashboard
 ## **Conclusion**
You’ve integrated QStash with Prometheus. Use Grafana to explore message throughput, retries, DLQ, schedules, and Upstash Workflows.
If you encounter issues, contact support.
## **Conclusion**
You’ve integrated QStash with Prometheus. Use Grafana to explore message throughput, retries, DLQ, schedules, and Upstash Workflows.
If you encounter issues, contact support.